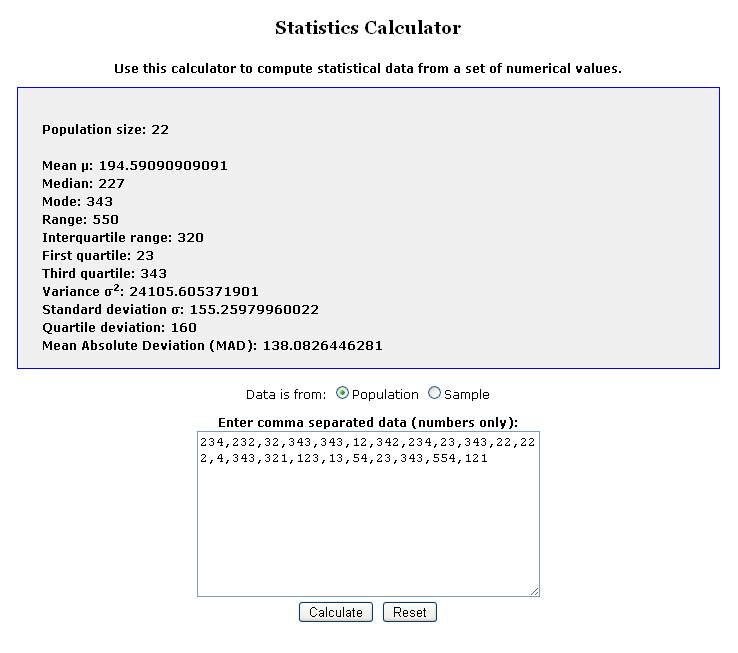
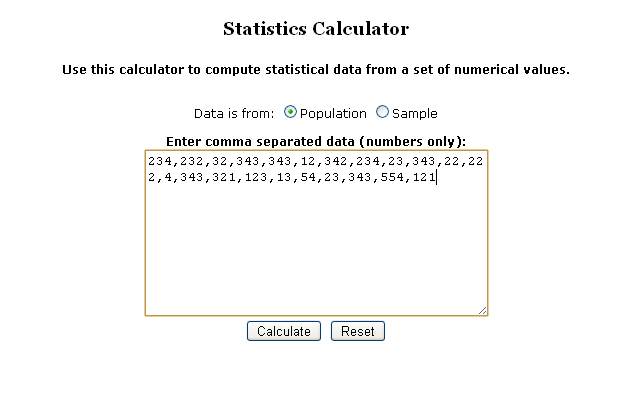
Alcula now features a simple statistics calculator for calculating averages (mean, median and mode) and measures of dispersion (standard deviation, ranges etc.) from a set of numerical values that you provide. You can paste your data from a spreadsheet or a text file or enter the individual values manually.
You can enter up to 1000 numerical observation values, separated by commas, spaces or newlines. This should make it easy to paste data from any source.
How does the statistics calculator work?
Click on statistics calculator or use the navigation links at the top of the page to go to the calculator. You are presented with a simple text field where you can enter or paste the numerical data values:
- Use the top selector to specify whether the data you are entering represents an entire population or just a sample taken from a population (see statistical population for more information). This parameter affects the calculation of the variance and standard deviation.
- Enter the data. You can manually type the numerical values inside the box or you can paste data from another application, such as a spreadsheet or a text file. To copy data from a spreadsheet, select the data, press cntrl-c to copy it, select the statistics calculator input text area and press cntrl-p to paste.
- Press “Calculate”. The data is submitted and the results are displayed at the top of the page.

Press the “Reset” button to erase all data before performing a new calculation.
What does it calculate?
The statistics calculator currently calculates the following statistical measures:
- Mean
- Median
- Mode
- Range
- Interquartile range
- Lower and upper Quartiles
- Variance
- Standard deviation
- Quartile Deviation
- Mean absolute deviation
The mean, or arithmetic mean is the most commonly used average and is obtained by dividing the sum of the observation values by the number of observations.
The mode is the most commonly occurring value.
Median and quartiles are calculated from the sorted data.
The median is the value in the middle of the observed values.
The lower quartile is the value for which 25 percent of observations are lower.
The upper quartile is the value for which 75 percent of observations are lower.
The quartiles are used to calculate the inter quartile range and quartile deviation:
The inter quartile range is the difference between the upper quartile and the lower quartile and the quartile deviation is half the quartile range.
The range is the difference between the maximum and minimum value.
The ranges, mean absolute deviation, variance and standard deviation (the square root of the variance) are measures of dispersion and give an indication of how much the values are dispersed around the calculated average.
For more complete information about these statistical terms you can check the central tendency and statistical dispersion wikipedia articles.
Tags: average, Calculator, Calculators, dispersion calculator, first quartile, interquartile range, lower quartile, mean, mean absolute deviation, median, mode, Online Calculator, Online Calculators, quartile deviation, range, standard deviation, standard deviation calculator, statistical data calculator, statistics, third quartile, upper quartile, variance


